1. AI Compute
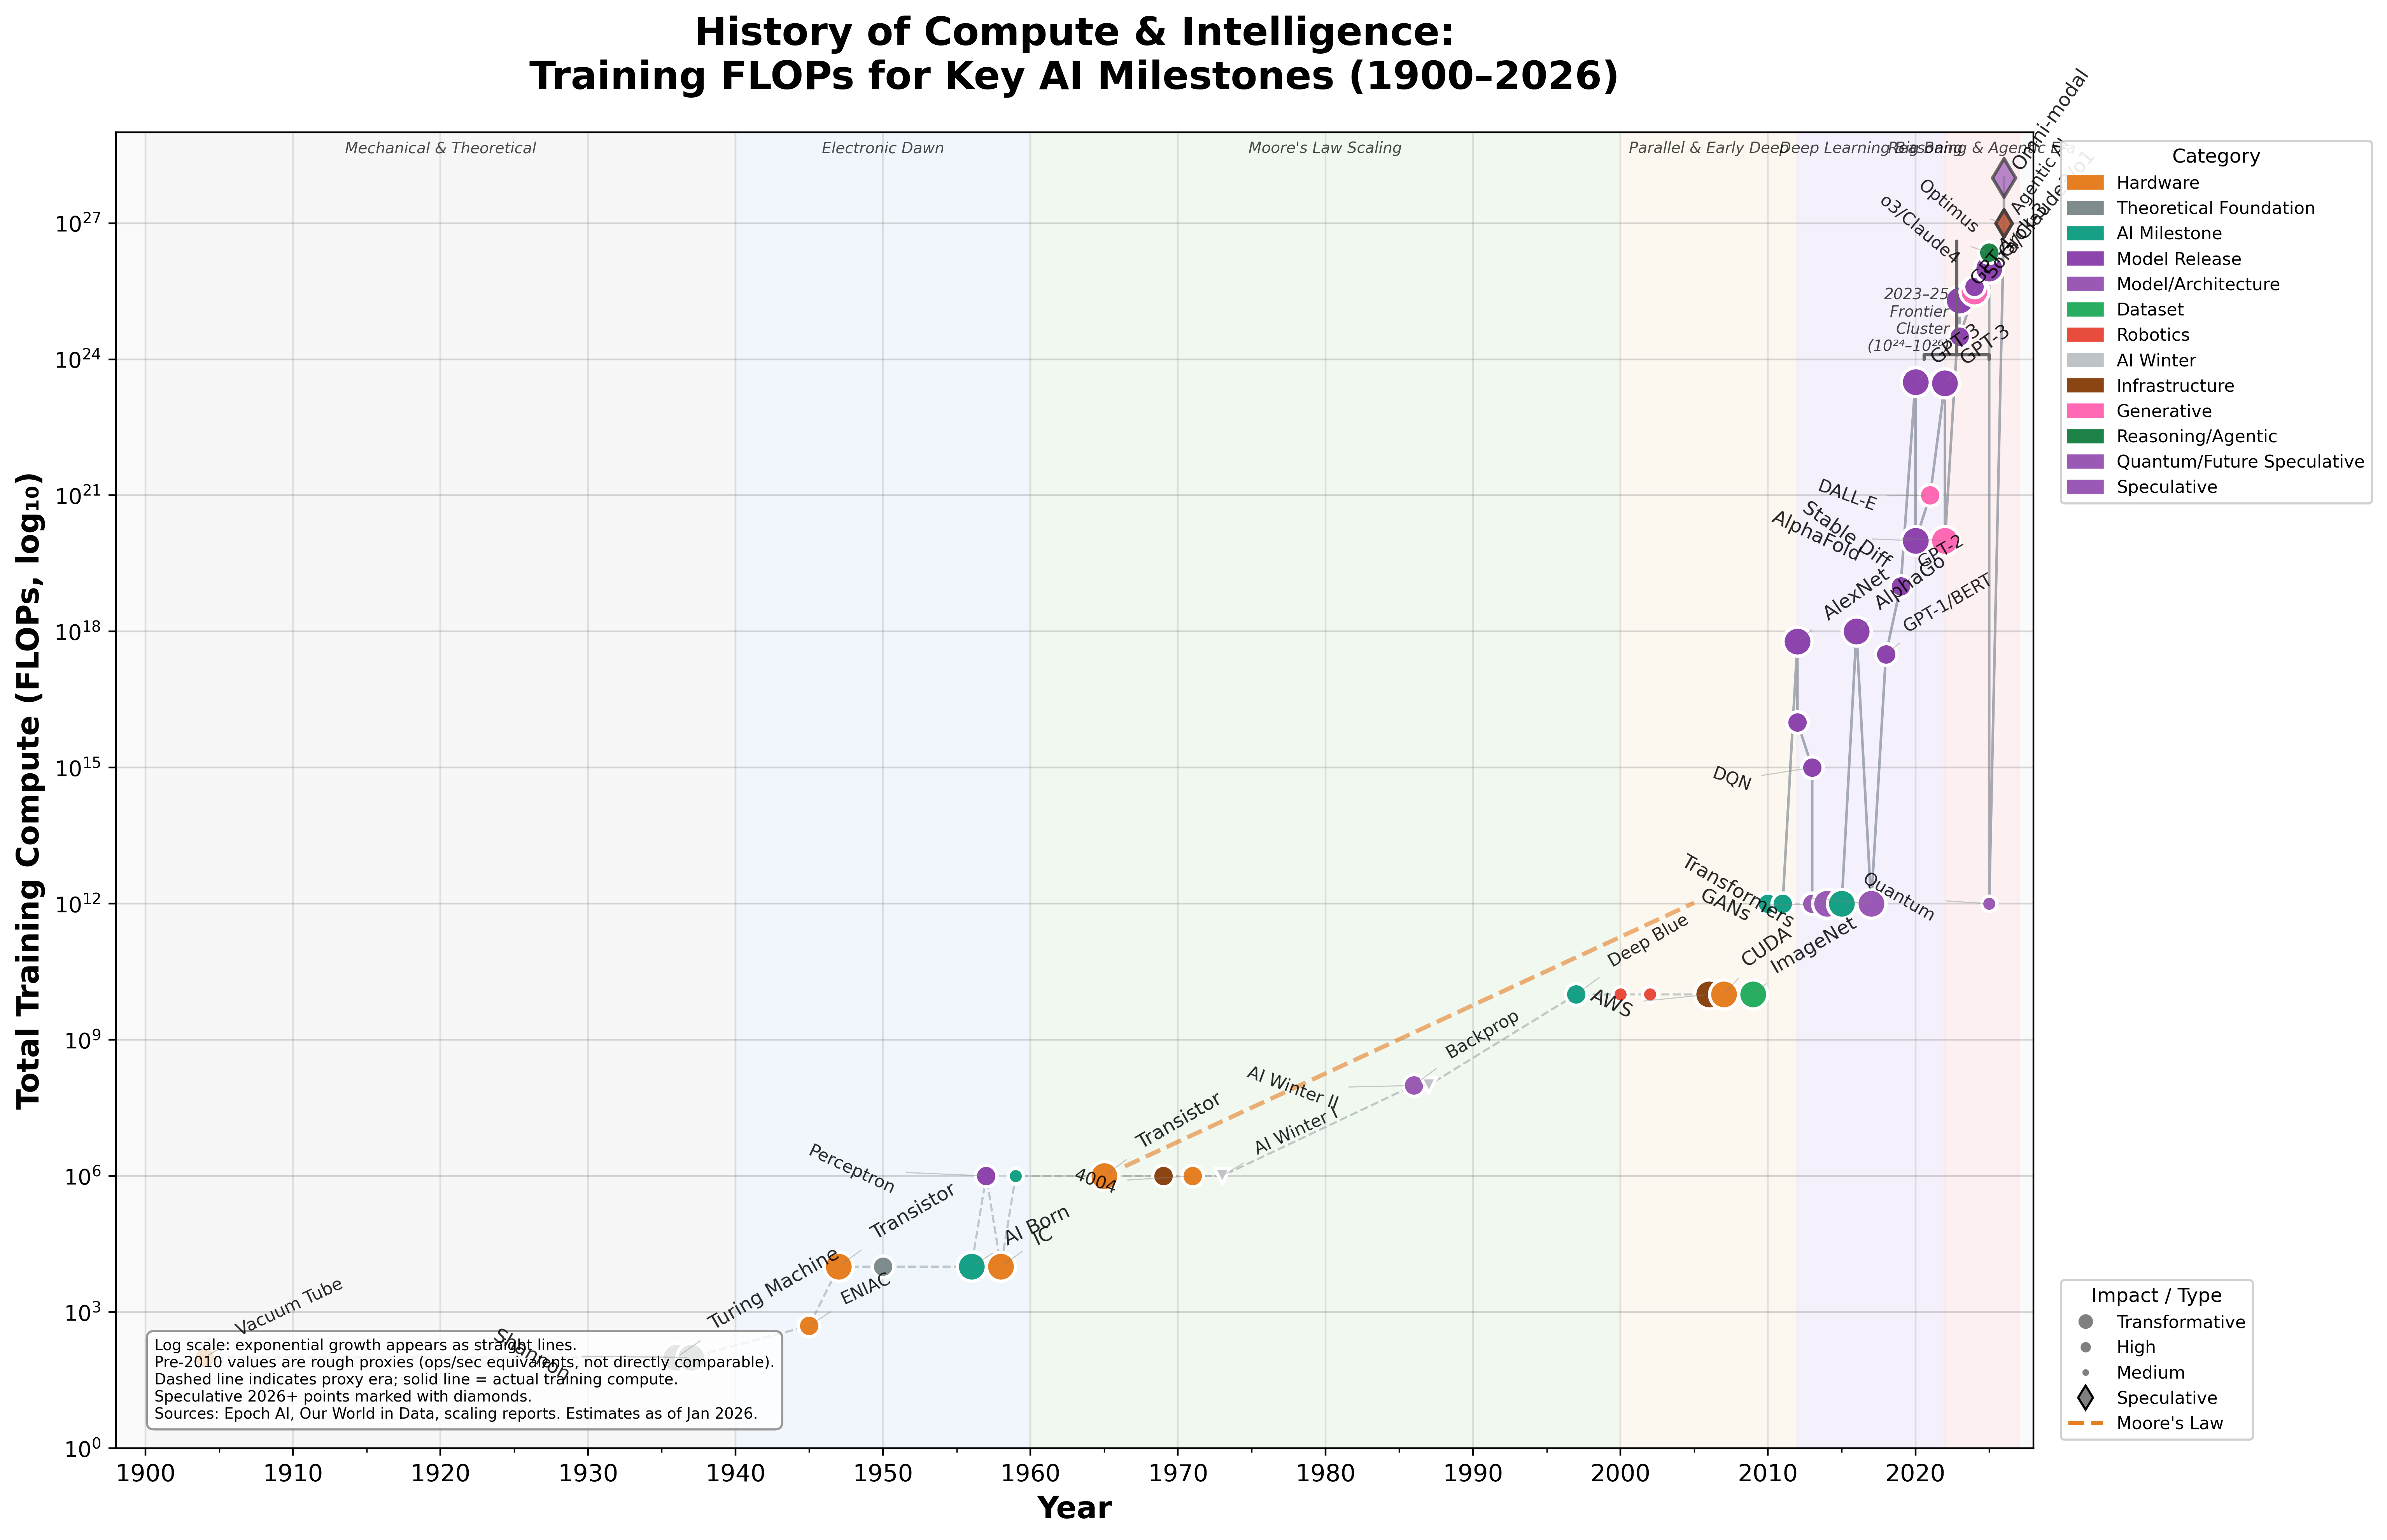
AI Compute Timeline
HistoricalEstimatedSpeculative
10^27+ FLOPsData confidence: Mixed
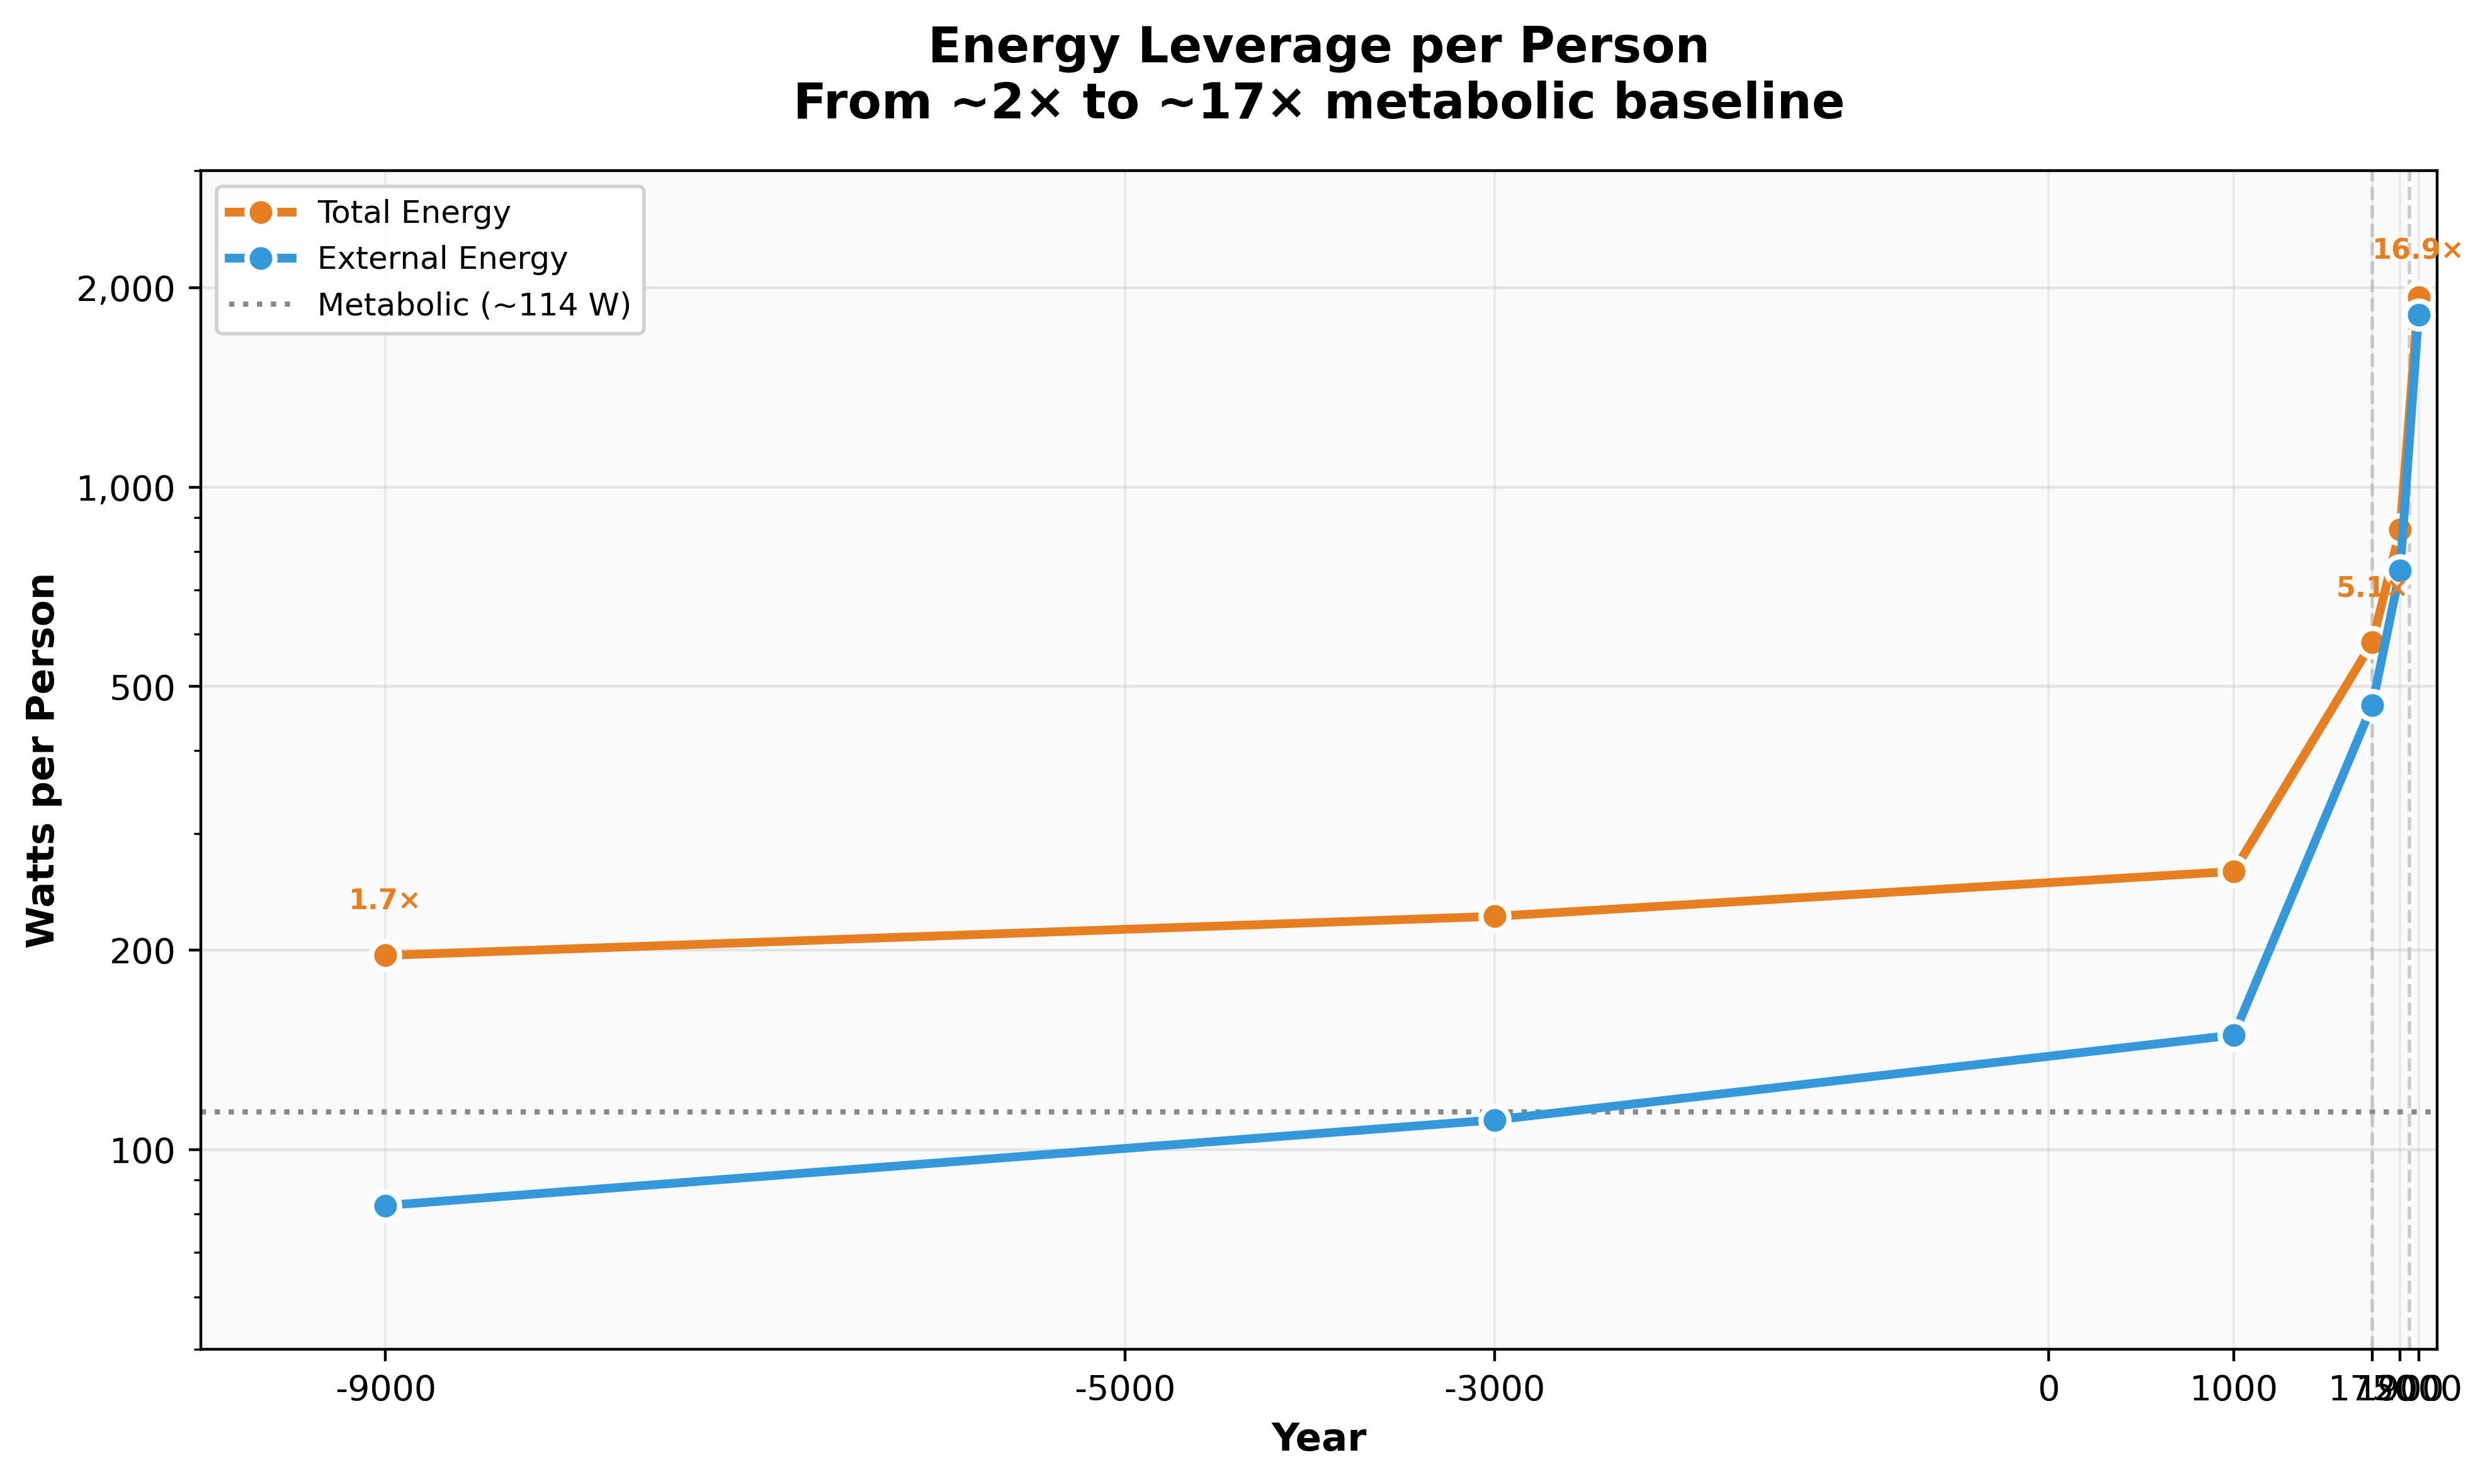
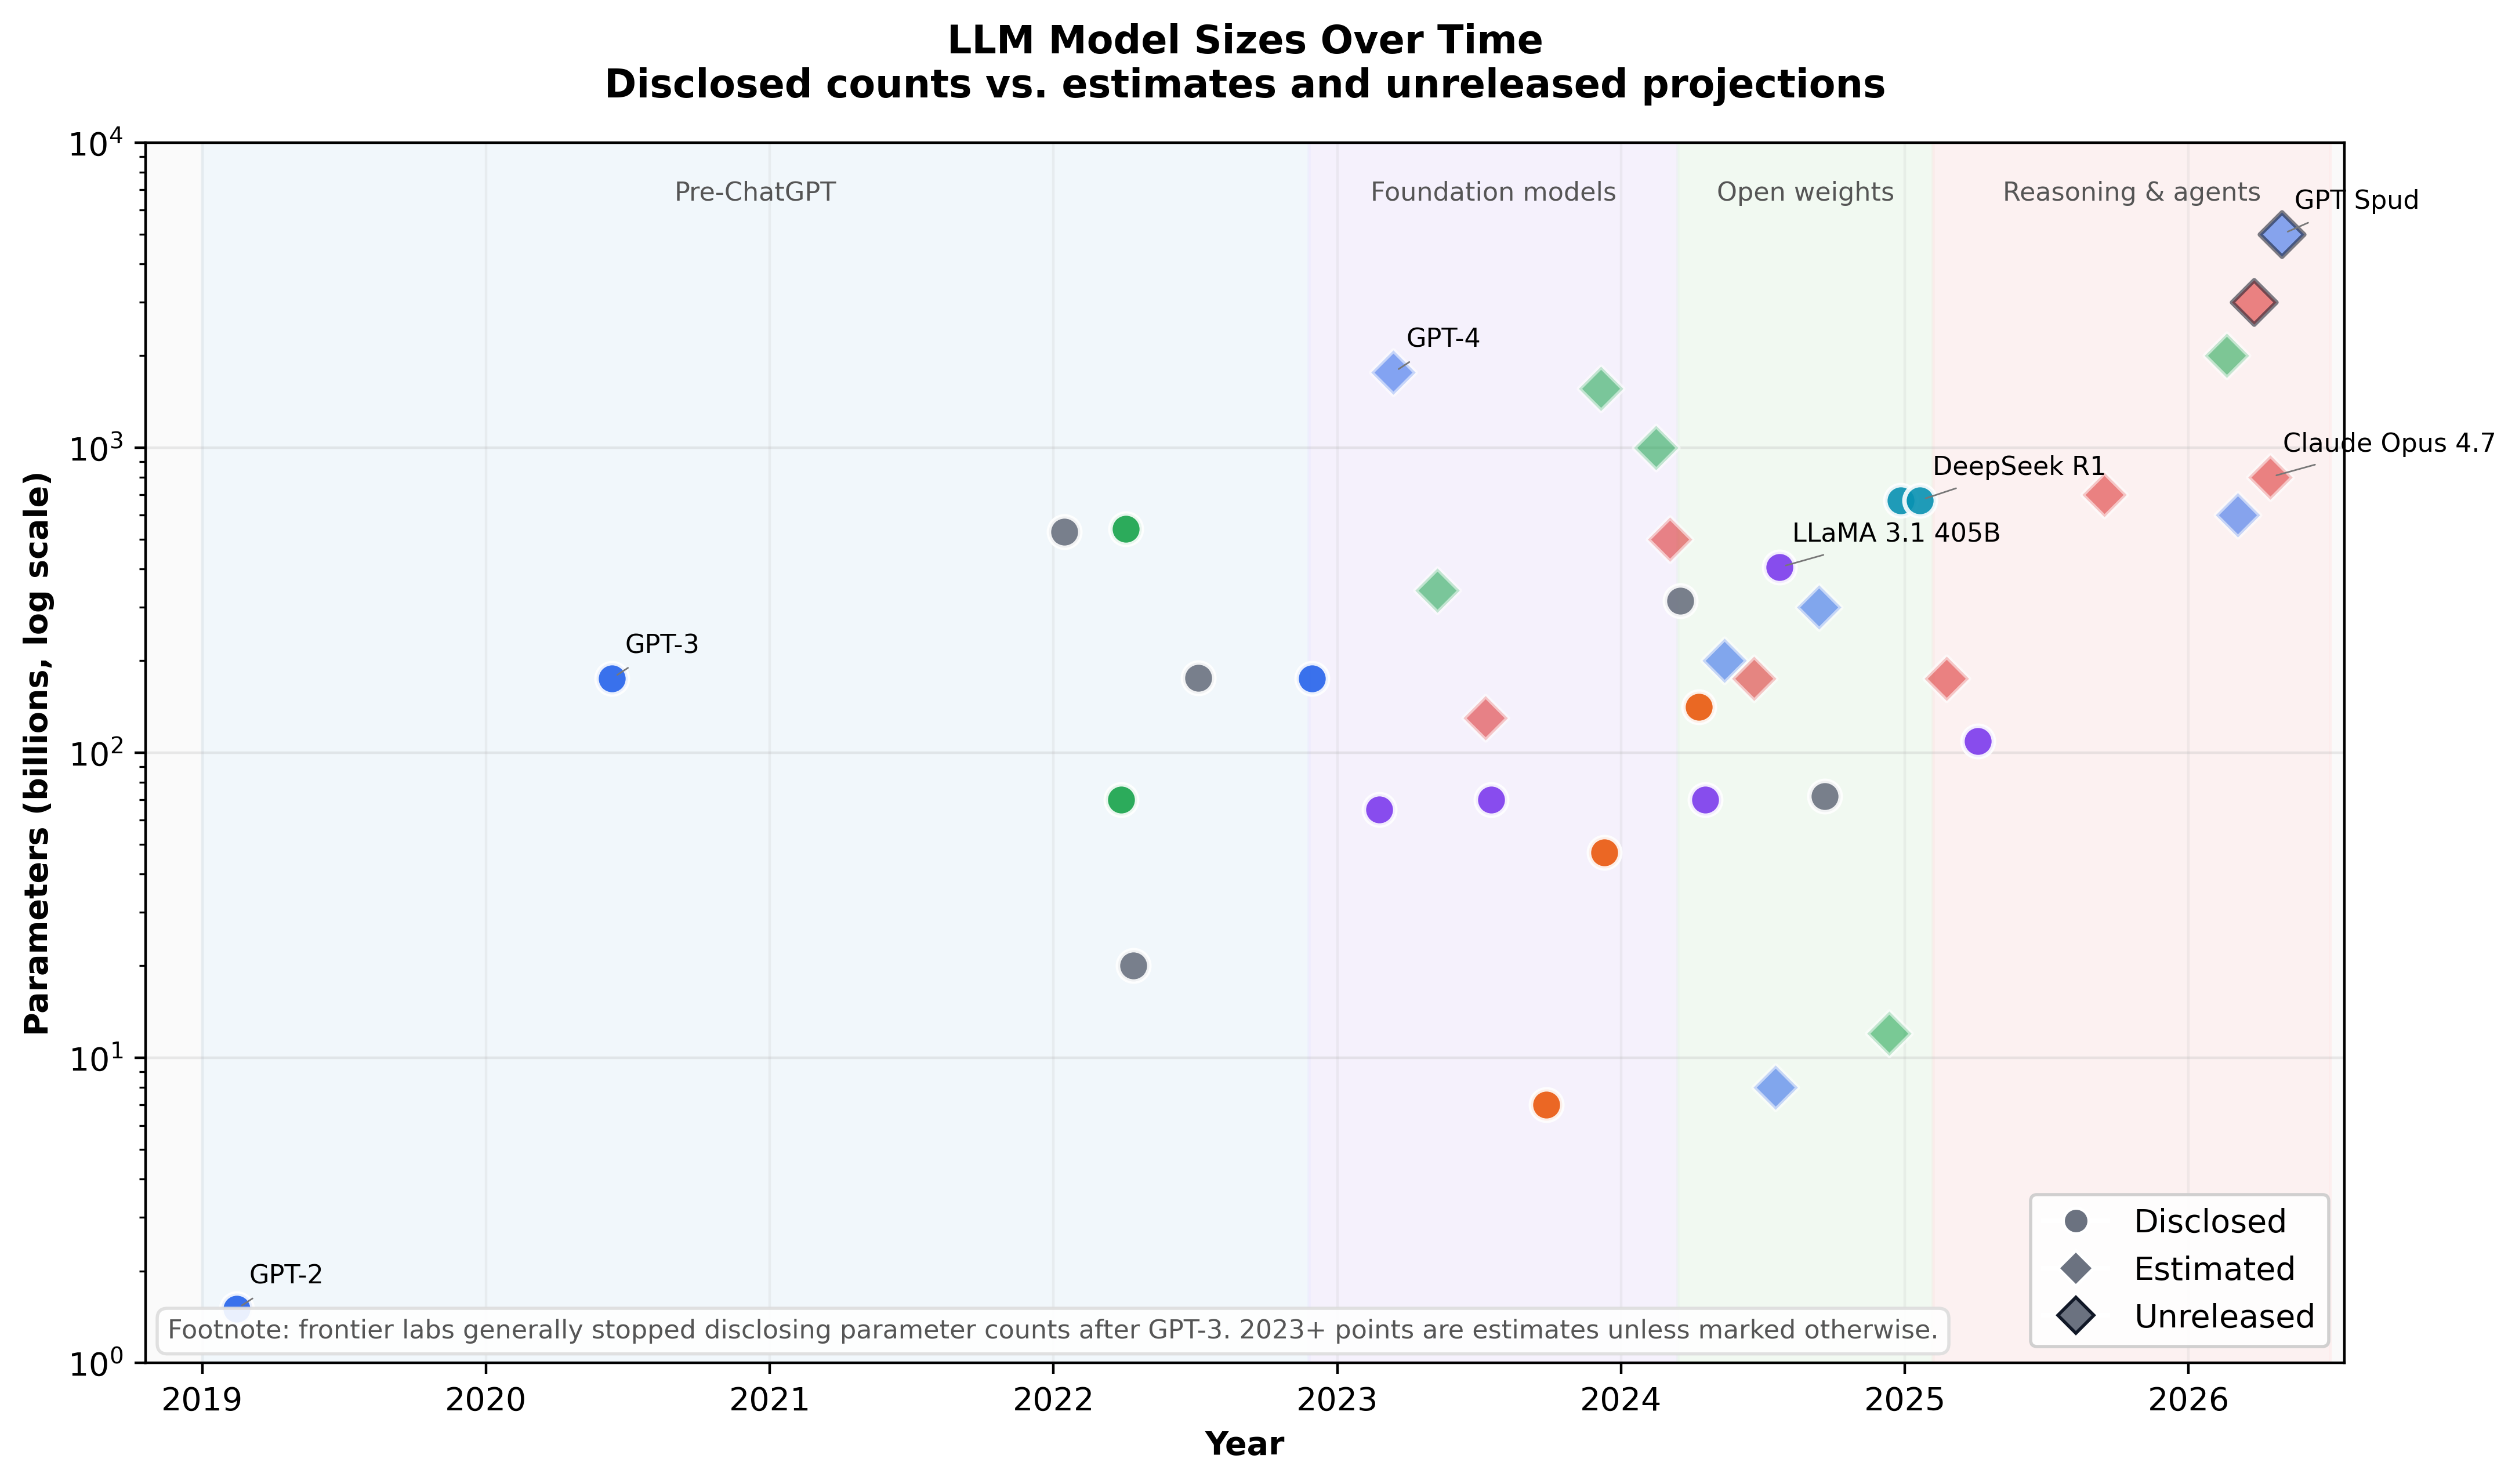
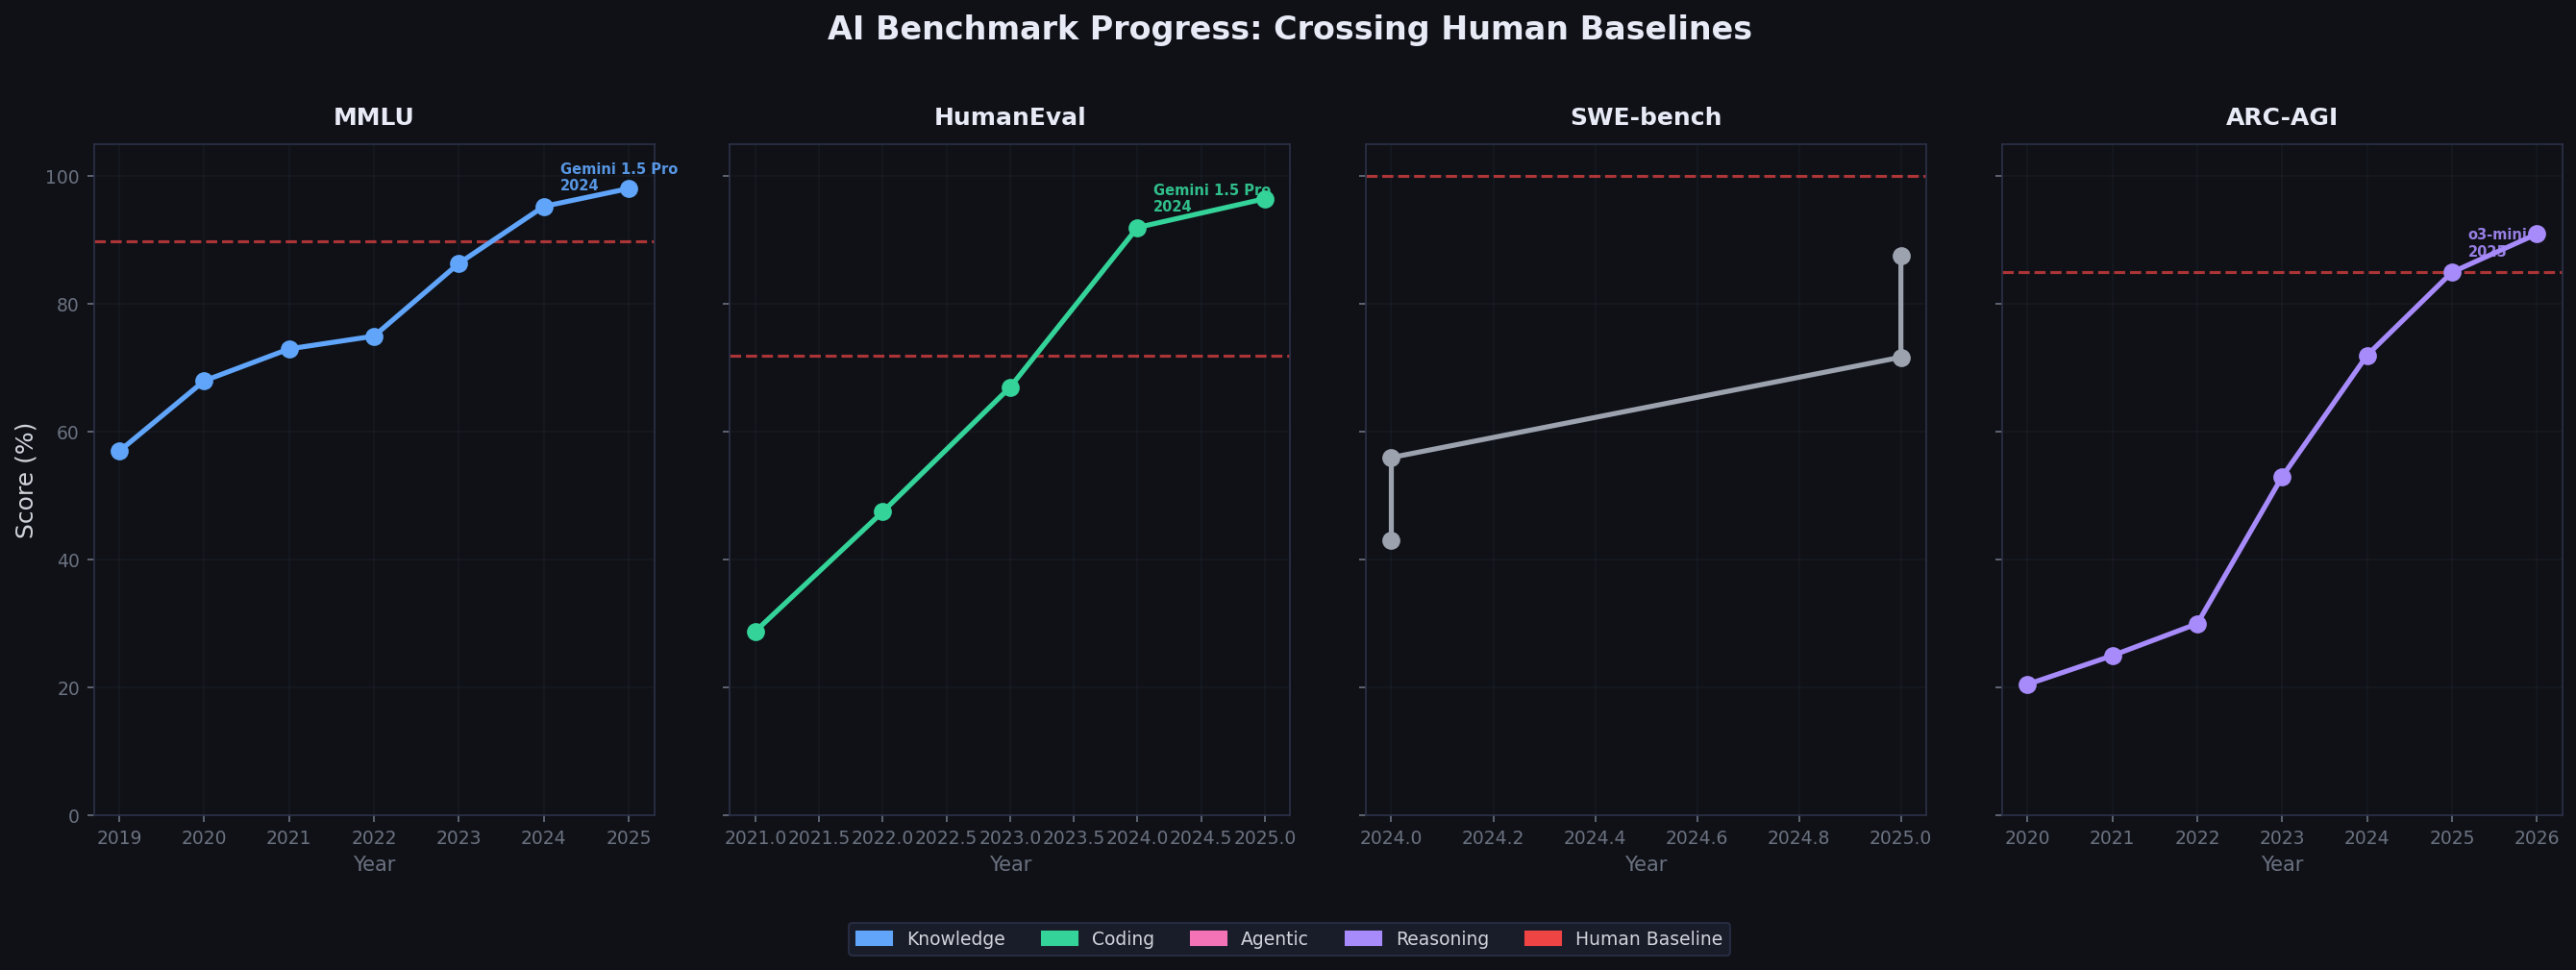
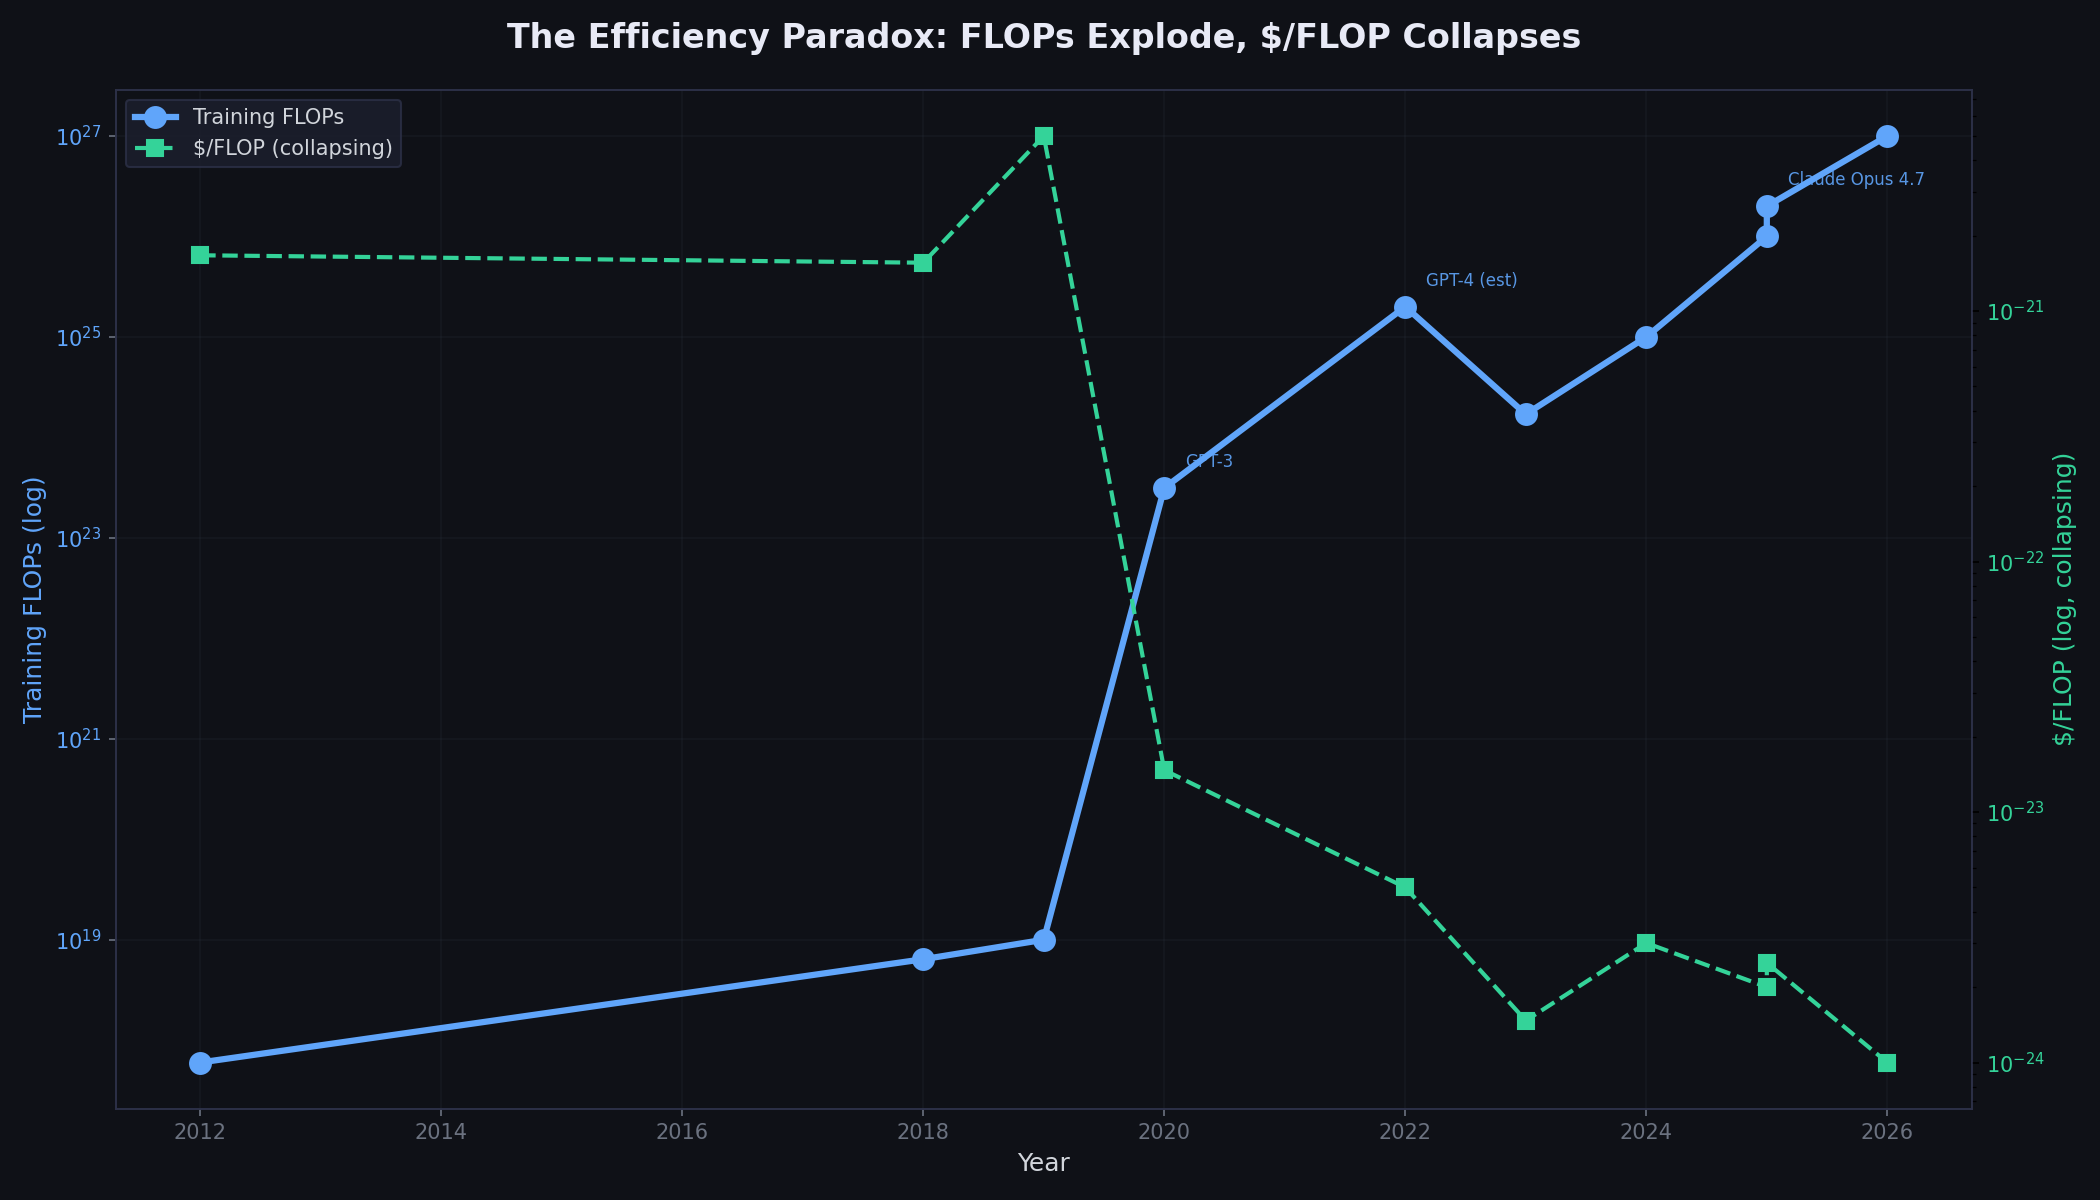
Training compute from early electronic computing to frontier AI, with proxies and speculative projections labeled separately.